Plunger Optimization App
Data Scientist/Developer: Manuel Solalinde (manolosolalinde@gmail.com)
Plunger lift cycles a mechanical plunger through the production tubing to lift accumulated liquids and keep marginal and declining gas wells flowing — but at fleet scale, knowing which wells to act on, and why, is the hard part. This production data-analytics platform turns raw 15-second SCADA data into fleet-scale insight that lets reservoir and production engineers act with confidence: it surfaces optimization opportunities, detects mechanical and reservoir problems early, validates database records against real operating behaviour, and checks compliance with manufacturer specifications — across the entire well portfolio rather than one well at a time.
Applications
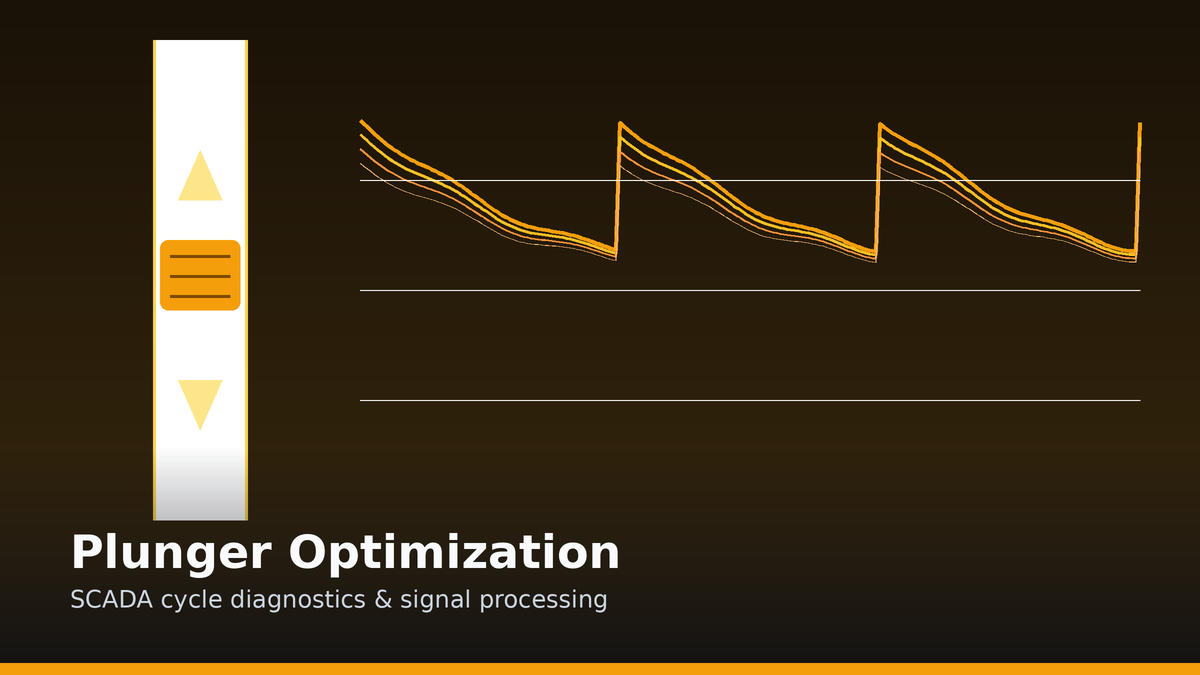
- Plunger Optimization Plots — interactive well-analysis interface. Search and filter wells by name, route, operator or ID; plot any plunger cycle-statistic over time with automatic aggregation (daily for long ranges, cycle-level for short ones); browse pre-configured metric templates (pressures, differentials, gas rates, durations); and overlay multiple cycles in stacked-cycle plots synchronized on valve closure to spot patterns and anomalies. Includes outlier detection, trend/correlation analysis and CSV export.
- Simple Plunger Fall Calculator — a per-well design tool that pulls the last 30 days of gas/water production, applies the selected plunger brand/type specs, and computes the shut-in fall time (
BumperSpringDepth / ShutinFallRate) with manual override. - Reports — an automated diagnostic report suite (below).
Diagnostic Report Suite
- PCS — Plunger Cycle Statistics: High Flow Rate Close (HFRC), LF Min, Time-to-Load-Factor 0.40 (TTLF 040) and LF Reliability.
- SI — Sustained Increase (pressure monitoring): casing–tubing differential, casing pressure, casing–line differential and line-pressure surge.
- Advanced diagnostics: Casing Sway, Data Quality, ML-based Continuous vs Conventional classification (validates DB records against actual operating mode), and Plunger Operating Range Compliance (POCR).
Reports run daily across the entire well portfolio, with multi-level aggregation (cycle → daily → date range), graceful handling of missing/shut-in data, confidence scoring and moving-average trend detection.
Hard problems solved
Extracting trustworthy diagnostics from noisy, high-frequency field data required solving several non-trivial signal-processing problems:
- Plunger-arrival detection from the maximum of the cumulative tubing-pressure slope — a robust way to pinpoint the arrival event without relying on fragile per-sample thresholds.
- PTTrips-based cycle identification using actual plunger trip timestamps for accurate valve open/close and plunger-arrival detection, eliminating pressure-slope estimation error.
- Load Factor, the key effectiveness metric —
LF = (Casing Pressure − Tubing Pressure) / (Casing Pressure − Line Pressure)— normalized so well effectiveness is comparable across differing pressure regimes. - Sustained-increase metrics computed on 5-minute resampled series with Savitzky-Golay smoothing and moving-average (14/7/5/2-day) comparisons.
- Daily fleet-scale report generation with multi-level aggregation (cycle → daily → date range) and graceful handling of missing and shut-in data, so a single run yields consistent diagnostics across the entire portfolio.
Design decisions & trade-offs
- Cycle identification from SCADA ground truth, not estimation. Used PTTrips actual plunger trip timestamps to define each cycle rather than estimating valve open/close from pressure-slope behaviour — chosen to eliminate estimation error by anchoring on what the controller actually recorded.
- Smoothing for clarity over raw resolution. Applied Savitzky-Golay smoothing on 5-minute-resampled series instead of analysing raw 15-second data — a deliberate clarity-vs-compute trade-off that suppresses sensor noise and keeps fleet-wide report runs tractable while preserving the trends that matter.
- ML classification instead of fixed thresholds. Classified Continuous vs Conventional operating mode with a trained model rather than hard-coded thresholds — this validates the database's recorded operating mode against observed behaviour and adapts across wells that fixed rules would mislabel.
Architecture
Python + Streamlit web app with Plotly visualization, backed by data in AWS S3 (parquet). The interactive app runs on ECS Fargate; daily report generation runs on an EC2 batch runner and on-demand Lambda functions, scheduled via CloudWatch Events. Images are published through ECR, infrastructure is managed as code with Pulumi, and CI/CD runs on GitHub Actions.
Note: Screenshots and architecture diagrams are omitted, as they display proprietary client data and systems. Available on request, subject to client approval.